

Forecasting Overview
How Forecasting Works
The Forecasting wizard can be used to project future values in a time series, such as corporate sales over the next four quarters. The wizard relates to row data as a time line, and builds additional rows for forecasting purposes. The wizard provides six built-in forecasting models and also allows you to design your own custom forecasting models. At any point in time, there can be one (and only one) forecasting model attached to the query.
Accessing the Forecasting Commands
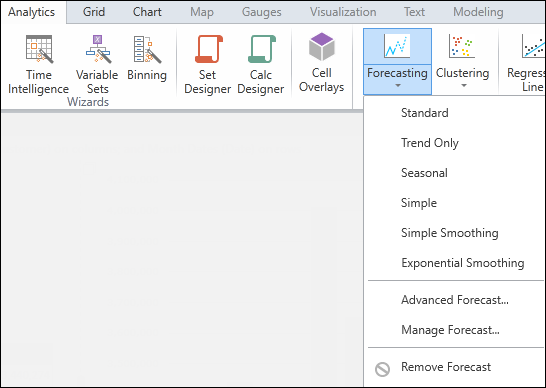
To access the forecasting commands, click Forecasting icon in Data Discovery/Analytics ribbon.
- Basic Forecasting - Attach to your query one of the six built-in forecasting models:
- Standard
- Trend Only
- Seasonal
- Simple
- Simple Smoothing
- Exponential Smoothing
- Advanced Forecasting - Open wizard to design your own custom forecasting models.
- Manage Forecasting Models - Manage your custom forecasting models.
- Remove Forecasting - Detach the forecasting model from your query AND rerun the query without forecasting.
Tips for Working with Forecasting
Here are some quick tips for working with forecasting.
- Forecasting will not run if there are empty cells in the grid.
- Forecasted cells appear within report grids/charts but cannot be managed from the selection/hierarchies/elements panels.
- If your input grid values change, the query must be rerun to update the content of forecasted cells.
- Forecasted cells are labeled/highlighted within the grid and within other visual components.
- Once attached to a query, a forecasting model remains part of the query unless removed by the user.
- Turning on row nesting removes the forecasting model from the query (and disables the Forecasting button).
Example of Forecasting
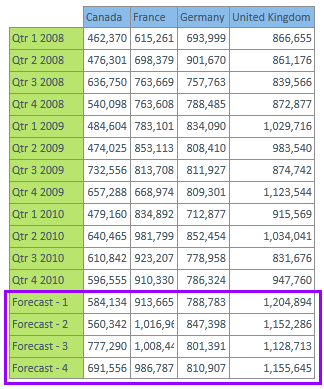
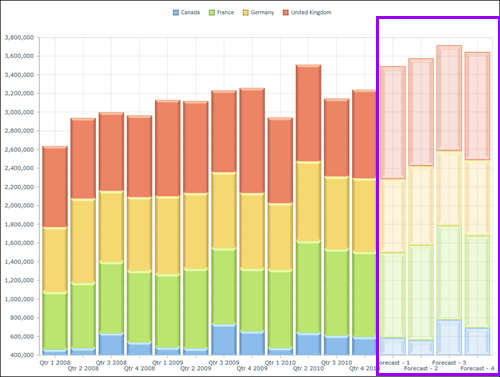
In the example below, we have forecasted four upcoming quarters based on 12 existing quarters. Note that the forecasted rows are clearly marked in both the grid and chart.
In the grid, you can hover your mouse over forecasted headers to display forecasting model information.
In the chart, you can hover your mouse over forecasted bars to display forecasting stats.
See Also
Home |
Table of Contents |
Index |
User Community
Pyramid Analytics © 2011-2022